KPI (Key Performance Indicator)
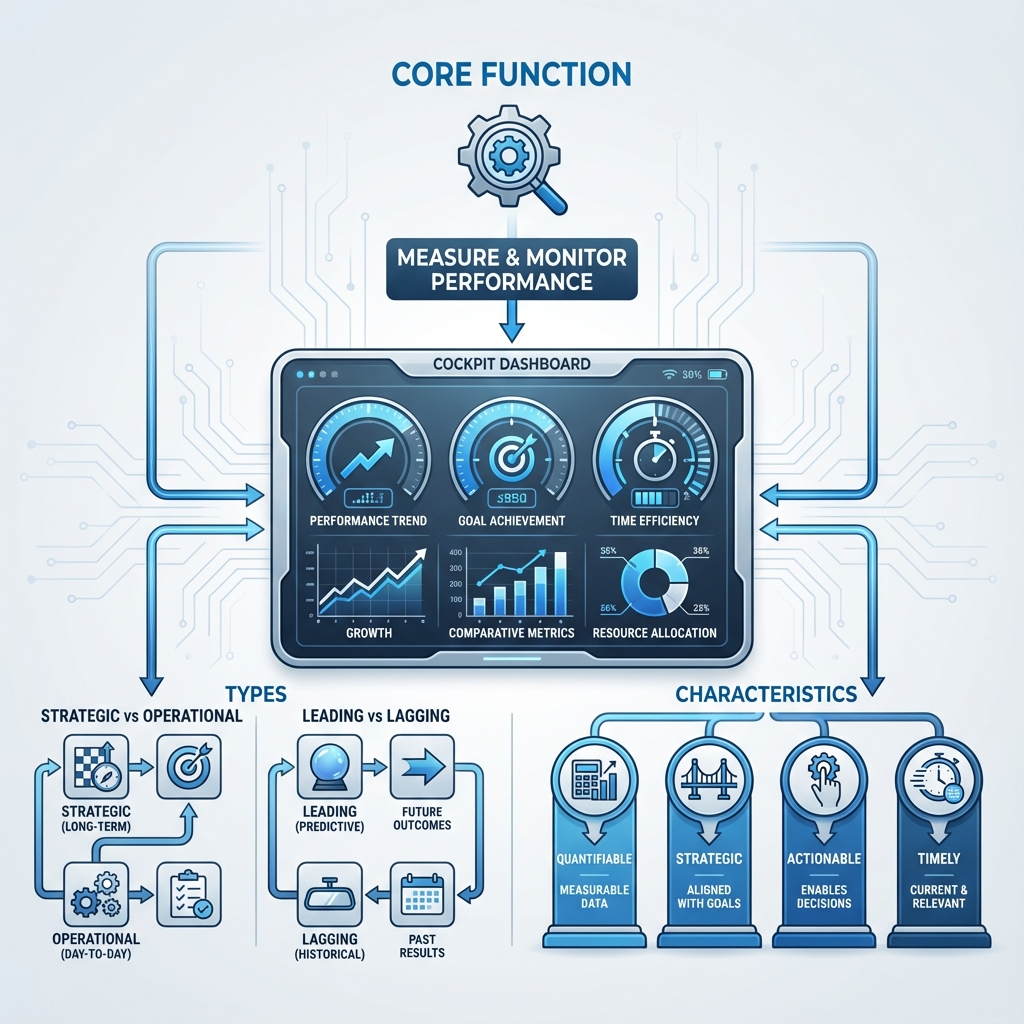
In complex organizational operations, how can managers quickly and accurately assess the health of the business, the efficiency of processes, and the effectiveness of strategy execution? KPI (Key Performance Indicator) is a core management tool designed for this purpose. It is not an abstract concept, but a specific, quantifiable measurement standard used to continuously monitor and evaluate the performance of an organization, a team, or an employee in achieving their key business objectives. A KPI is like an airplane's cockpit dashboard; it translates complex operations into a few key, clear readings, allowing the pilot to understand the flight status in real-time and make timely adjustments.
The essence of KPI lies in "Key." There can be thousands of measurable data points in an organization, but only those indicators that are closely linked to strategic goals and can truly reflect the core of performance can be called KPIs. It aims to direct the organization's attention to the most important things and provide an objective, unified data basis for performance management, goal setting, and continuous improvement. From measuring website visitor conversion rates to evaluating production line yield rates, and tracking customer service response times, KPIs are ubiquitous and an indispensable cornerstone of modern data-driven management.
Key takeaways
- A KPI is a metric tied to a key objective; not every metric is a KPI.
- Fewer is better: typically 3–7 per team or level.
- Mix leading and lagging indicators: lagging shows results, leading lets you act in time.
- Define each KPI precisely: formula, data source, owner, frequency, target.
- Watch for gaming: when a measure becomes a target, people optimize the number, not the outcome (Goodhart's law).
Characteristics and Types of KPI
An effective KPI typically possesses the following characteristics:
- Quantifiable: Must be measurable with numbers.
- Strategic: Must be directly linked to the organization's strategic goals.
- Actionable: Changes in the indicator should clearly point to specific actions that need to be improved.
- Timely: Can be tracked and reported regularly and promptly.
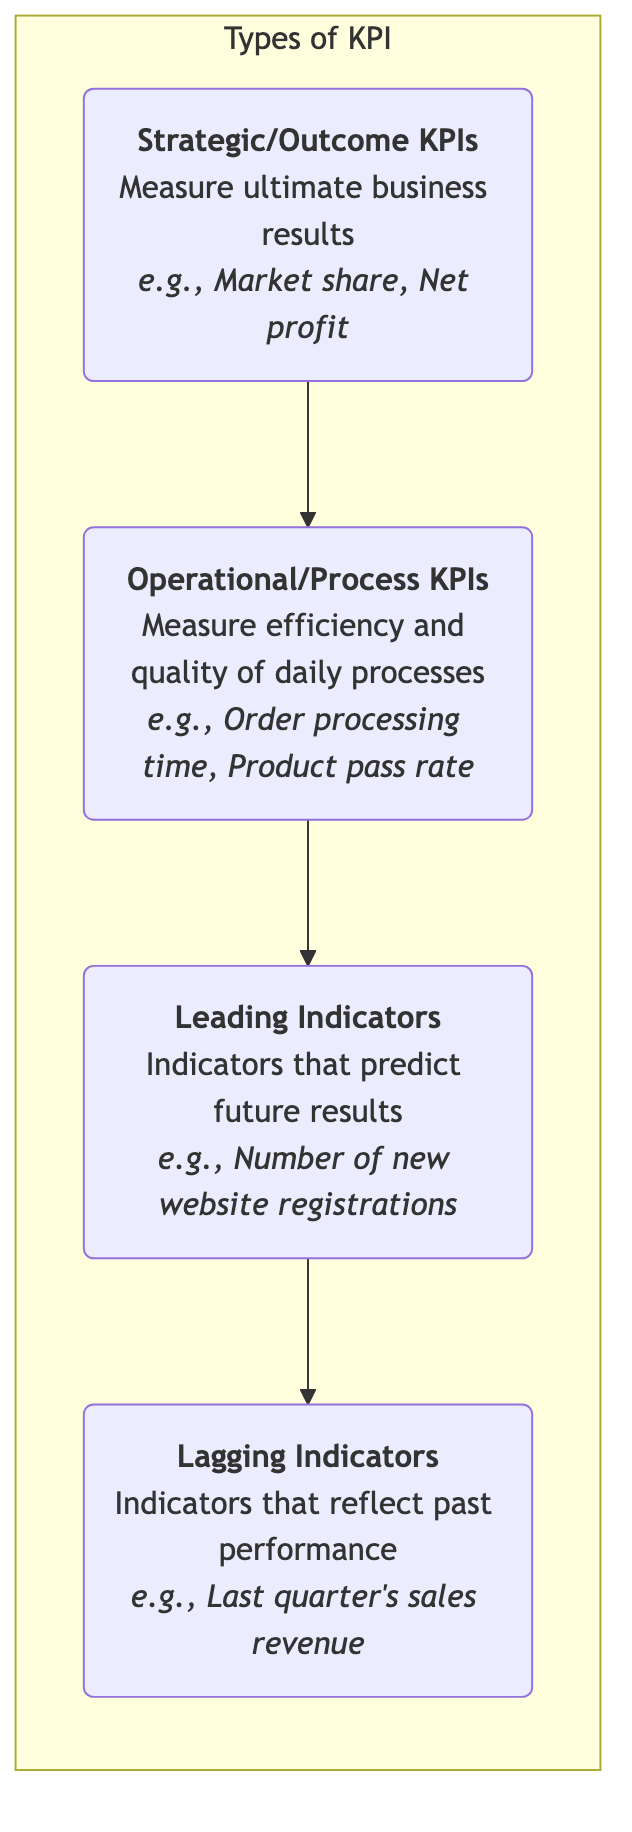
Based on their content, KPIs can be divided into various types:
How to Set and Use KPIs
-
Step One: Clarify Your Strategic Goals KPI setting must begin with a deep understanding of strategy. You must clearly know, "For our organization/team, what does success mean?" For example, an e-commerce company's strategic goal might be "increase customer loyalty."
-
Step Two: Ask Key Business Questions Translate strategic goals into a series of specific business questions. For the goal of "increase customer loyalty," key questions might be: "How often do our customers make repeat purchases?" "Are our customers willing to recommend us to others?"
-
Step Three: Select and Define Key Performance Indicators For each key question, find one or more quantifiable indicators that best answer it. At this step, strive for conciseness and avoid "metric bombardment."
- To answer "customer repeat purchase frequency," you can choose "customer annual purchase frequency" or "customer repurchase rate" as KPIs.
- To answer "customer willingness to recommend," you can choose "Net Promoter Score (NPS)" as a KPI.
-
Step Four: Set Targets and Thresholds Set a specific target value for each KPI, and optionally set different performance thresholds (e.g., red alert zone, yellow warning zone, green healthy zone) for quick visual management.
-
Step Five: Determine Data Sources and Reporting Frequency Clearly define where the data for each KPI comes from, who is responsible for collecting it, and what the reporting frequency is (daily, weekly, or monthly reports).
-
Step Six: Regular Review and Take Action Regularly (e.g., at weekly meetings or monthly business analysis meetings) review KPI performance. The focus of the review is not to judge, but to analyze and act. When a KPI performs poorly, it is necessary to deeply analyze the reasons behind it and formulate specific improvement measures.
Application Cases
Case 1: E-commerce Website Operations
- Strategic Goal: Improve website profitability.
- Key KPIs:
- Conversion Rate: Measures the efficiency of website traffic converting into actual purchases.
- Average Order Value (AOV): Measures the average amount of each order.
- Customer Lifetime Value (CLV): Predicts the total profit each customer can bring in the future.
Case 2: Call Center Customer Service
- Strategic Goal: Provide efficient and high-quality customer support.
- Key KPIs:
- First Call Resolution (FCR): Measures the ability to resolve customer issues in a single call.
- Average Handle Time (AHT): Measures the average efficiency of handling a customer request.
- Customer Satisfaction (CSAT): Directly measures customer satisfaction with the service through post-service surveys.
Case 3: Human Resource Management
- Strategic Goal: Attract and retain top talent.
- Key KPIs:
- Employee Turnover Rate: Measures talent retention, especially "key position employee turnover rate."
- Employee Engagement Index: Measures employee involvement and satisfaction through annual engagement surveys.
- Cost Per Hire: Measures the efficiency of recruitment activities.
Advantages and Challenges of KPI
Core Advantages
- Provides Objective Basis: Transforms vague "good or bad performance" into objective, unified data, providing a basis for performance evaluation and decision-making.
- Focuses on Key Areas: Guides the organization to focus its attention on activities most critical to strategic success.
- Promotes Communication and Transparency: Clear KPIs allow every employee to understand how their performance is measured and how they contribute to team goals.
Potential Challenges
- One-Sidedness of Metrics: If KPIs are set improperly, it may lead to "metricism" or short-sighted behavior. For example, if only "number of calls answered by the call center" is assessed, customer service representatives might sacrifice call quality to pursue quantity.
- "What can be quantified is not necessarily important, and what is important is not necessarily quantifiable": Over-reliance on KPIs may overlook factors that are difficult to quantify but equally important, such as organizational culture, innovation spirit, etc.
- Requires Dynamic Adjustment: As strategies and market environments change, KPIs must be regularly reviewed and adjusted, otherwise they may become rigid and outdated.
Leading vs. Lagging Indicators
| Lagging indicator | Leading indicator | |
|---|---|---|
| Measures | Outcomes that have already happened | Activities or conditions that predict outcomes |
| Example (sales) | Quarterly revenue | Qualified pipeline value, number of demos |
| Example (customer service) | Customer churn rate | First-response time, unresolved tickets older than 48 h |
| Strength | Clear link to goals | Allows timely action |
| Weakness | Too late to change | Must actually predict the outcome |
KPI Definition Template
| Field | Example |
|---|---|
| Name | Customer churn rate |
| Objective it supports | Grow recurring revenue |
| Formula | Customers lost in month ÷ customers at start of month |
| Data source | Billing system |
| Owner | Head of Customer Success |
| Frequency | Monthly |
| Baseline / target | 3.2% → 2.5% by Q4 |
| Thresholds | Green ≤ 2.5%, amber 2.6–3.0%, red > 3.0% |
| Related leading indicators | Product usage in last 14 days, support satisfaction |
Example KPIs by Function
| Function | Example KPIs |
|---|---|
| Sales | Revenue vs. target, win rate, average deal size, sales cycle length |
| Marketing | Cost per acquisition, marketing-qualified leads, conversion rate |
| Customer service | First-contact resolution, CSAT, average handle time |
| Operations | On-time delivery, defect rate, inventory turnover |
| HR | Voluntary turnover, time to hire, engagement score |
| Product | Active users, retention, feature adoption |
Common Mistakes
- Too many KPIs. Twenty "key" indicators means nothing is key. Choose the vital few and track the rest as ordinary metrics.
- Vanity metrics. Page views or social followers may look good while revenue falls. Choose metrics tied to real outcomes.
- Only lagging indicators. By the time revenue drops, it's too late. Add leading indicators you can influence.
- Unclear definitions. If finance and sales calculate "churn" differently, meetings become arguments about numbers.
- Rewarding the number alone. Targets without context invite gaming (e.g. closing support tickets prematurely). Pair KPIs with quality checks.
KPIs vs. OKRs vs. SMART Goals
| KPI | OKR | SMART Goals | |
|---|---|---|---|
| Purpose | Monitor ongoing performance | Drive change toward ambitious goals | Write a clear, achievable goal |
| Time frame | Continuous | Usually quarterly | Defined per goal |
| Typical use | Dashboards, health checks | Strategic priorities, focus | Individual and team goals |
Frequently Asked Questions
What is the difference between a KPI and a metric?
Every KPI is a metric, but not every metric is a KPI. A KPI is one of the few metrics directly linked to a key objective and used to steer decisions.
How many KPIs should a team have?
Usually three to seven. Enough to cover the most important outcomes and drivers, few enough to remember and act on.
What is Goodhart's law?
"When a measure becomes a target, it ceases to be a good measure." People optimize the number, sometimes in ways that harm the real goal. Balanced sets of KPIs and qualitative review reduce the risk.
How do KPIs relate to the Balanced Scorecard?
The Balanced Scorecard organizes KPIs into four perspectives (financial, customer, internal process, learning and growth) so that performance isn't judged on financial results alone.
Extensions and Connections
-
OKR (Objectives and Key Results): KPI and OKR are two complementary tools in modern goal management.
- KPI is more like a car's "dashboard," used to monitor routine metrics that need to be kept at a healthy level long-term (e.g., profit margin, customer satisfaction). Its goal is usually to "maintain" or "slightly optimize."
- OKR is more like a car's "navigation system," used to guide challenging, directional goals that require breakthroughs and innovation (e.g., "successfully enter a new market"). Its goal is to "achieve" a completely new state.
- In practice, a team's dashboard KPIs (e.g., "website crash rate must be below 0.1%") are the foundation for its normal operation, while their OKRs are the mountains they need to focus on conquering this quarter.
-
Balanced Scorecard: KPIs are the basic elements for building a Balanced Scorecard. The Balanced Scorecard provides a comprehensive framework to ensure that the KPIs you choose are balanced across the four perspectives: financial, customer, internal processes, and learning & growth.
Reference: The concept of KPI is rooted in modern management accounting and performance management theory. Robert S. Kaplan and David P. Norton, in developing the Balanced Scorecard, greatly promoted the application of KPIs in strategic management. In the digital age, KPIs have become a core component of data-driven decision-making culture.